
Michael_S
Members
-
Benutzer seit
-
Letzter Besuch
-
Hi Superp, this indeed looks like no calibration is taking place. The visible drift may be due to temperature and/or pressure changes over the days inside the closed bag; depending on if compensation was active. However, the absolute level is definitely wrong or strongly shifted. At the risk of making myself unpopular, however: since the calibration is obviously failing or not happening, you might consider reclaiming the sensor; after all, there is a two-year warranty. With a sensor that was purchased just five months ago, such a measurement error should not occur.
-
Hello Superp and borg, I agree with your opinion that the addition of FRC would be a useful feature. Especially to restore the functionality of sensors that have such strong deviations, like sensor A of Superb. As shown in the example on p. 3 of the Sensirion document, such strong deviations can occur e.g. if a sensor has fallen down (or has been treated roughly during shipping...). My assumption is that the optics in the sensor shifts a few micrometers, since the sensor uses an optical measuring principle, specifically the absorption of infrared radiation by CO2. (By the way, this is exactly how the greenhouse effect / climate change works...). However, as a default setting, I also think the ASC is reasonable. To reach 400 ppm in a common room is indeed possible, e.g. in rooms that are mechanically ventilated and where no persons are present for approx. > 5 hours. Alternatively, in case of long-term ventilation with fully opened windows (without persons present). However, depending on the outside temperature and wind, this can take up to 1 h (please switch off the heating beforehand). Thereby, however, the air inside becomes very dry.... An alternative idea to run the FRC: take a waste bag and shake it outside several times, so that it is completely flushed and filled by outside air. Put the sensors inside, close the opening / cable entry and press the FRC button that borg will soon install in BrickViewer :) Greets
-
Looks realy great, thank you for the pictures and informations! Think I will build a second and more compact one. Also with light and sound Bricklets and maybe (hopefully) with some new sensor Bricklets (?) For example Sensirion has some very interesting IAQ-combi-sensors^^ Also an update with the FLIR Lotus 3.5 for the Thermal Imaging Bricklet would be nice. Keep you informed!
-
Sounds great - I also thought about a mobile devices with a USB powerbank... Do you have a photo?
-
Gibt es hierzu irgendwelche News? Raspby und ESP32 Board sind doch ziemlich sperrig (physisch und in der Handhabung)...
-
Hi Superp, that sounds pretty interesting. Do you also operate your mobile sensor with a Raspby? Indeed, people's CO2 emissions vary strongly depending on activity (and body size). Sleeping about 8-11 l/h, sitting about 16-22 l/h and physically active about 34-44 l/h. In fact, CO2 concentration in outdoor air varies more globally than locally, see e.g. here. Interestingly, there is a tendency for little higher values in winter (northern hemisphere) of about +10-15 ppm, as plants then have a lower photosynthetic activity. However, significant differences between urban and countryside can be observed in particulate matter concentrations (Particulate Matter Bricklet). Best regards Michael
-
Thank you for the explanation. I found the file and it looks quite unremarkable. A few reboots and twice there were in deed some cecksum-errors at the port of the LCD, but then they disappeared as well.
-
I'm happy if the information was helpful. To be honest, I can even understand why Bosch doesn't really want to open the sensor's black box. Probably, no one could do anything with the "raw data" anyway. As mentioned, you only get a conductivity value or its change over time as a measurement signal. The sensor does not know which gases or which VOCs are reacting on the oxide layer... Therefore, a very robust evaluation routine is needed. Of course, this has its limits - but on the other hand the sensor is cheap and available in masses. Which log file do you mean exactly? (Unfortunately I'm quite a greenhorn concerning Pi OS and Linux based operating systems...) Indeed, the Raspby has certain performance problems from time to time. I.e. when I wipe between the tabs and want to access the tabs for which it has to calculate and visualize a long data history...
-
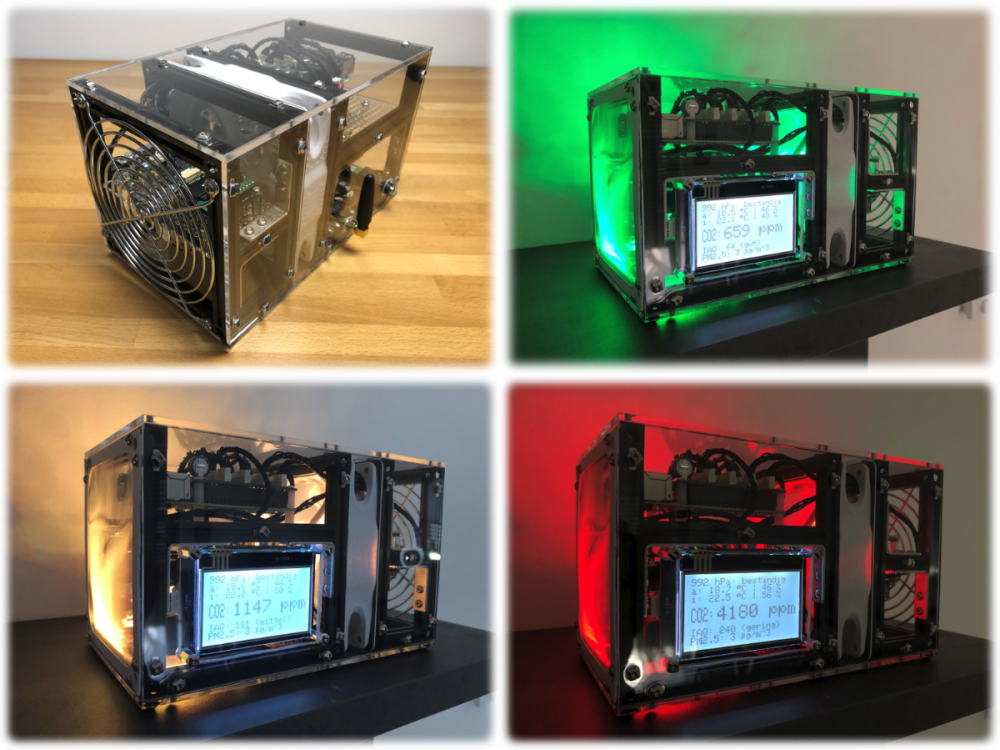
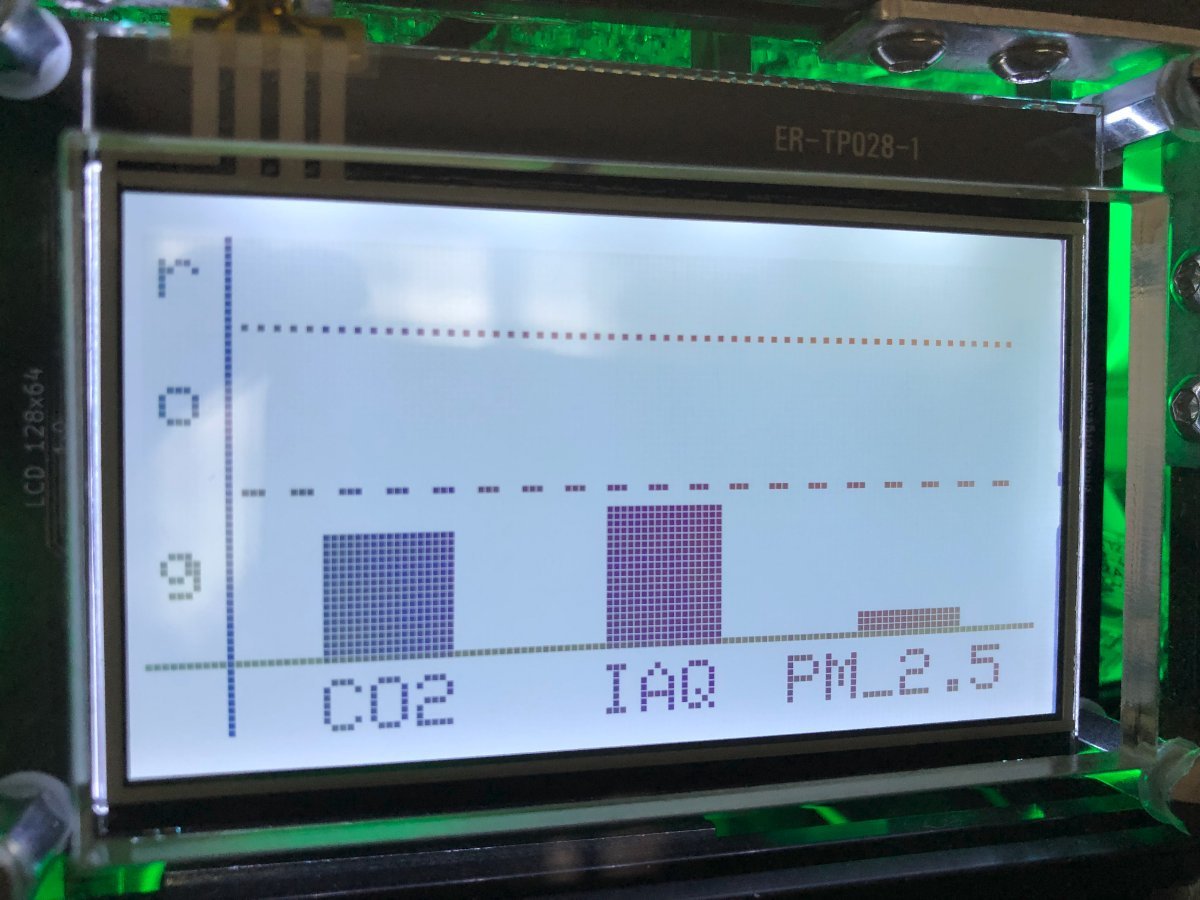
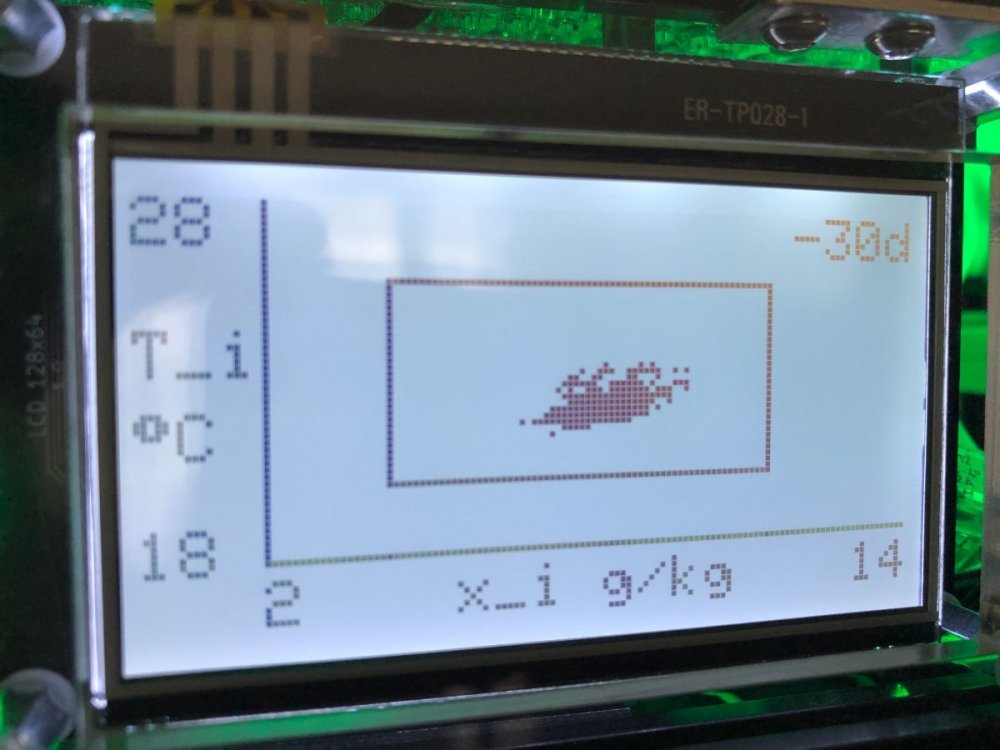
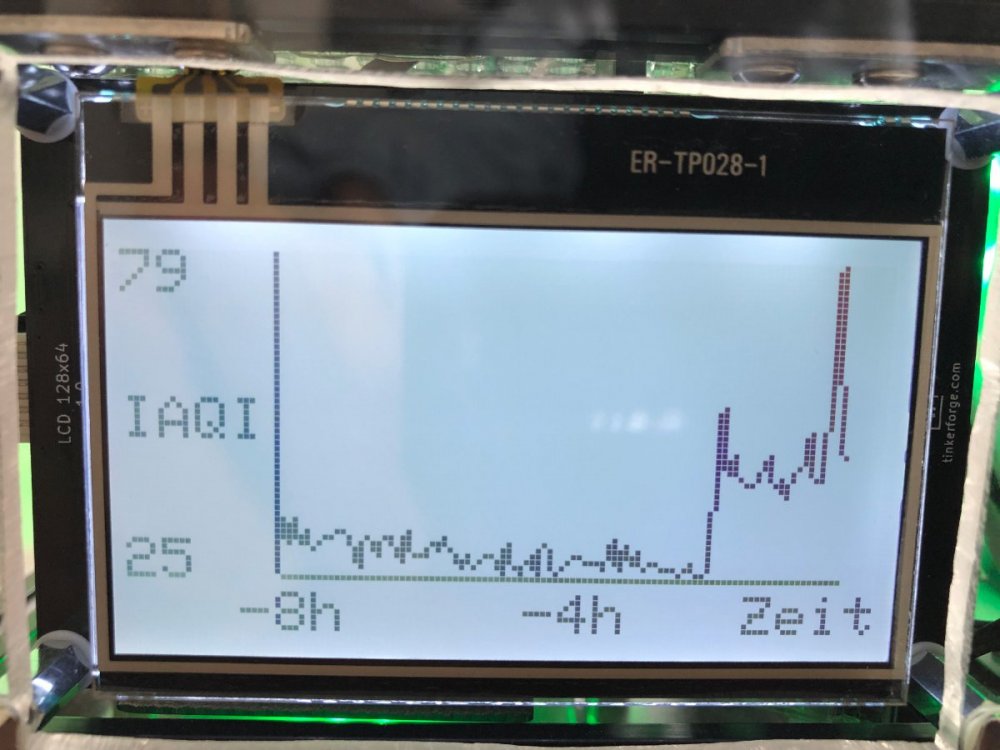
Hi @Superp, thank you very much for the positive feedback. In the meantime I have added some more visualizations of the measurement data (see pictures). Thanks also for the hint regarding the IAQ sensor. For this I have done some searching. I think the basic problem is the design of the BME680 itself. It is a metal oxide semiconductor gas sensor. The conductance of the material then changes depending on the chemical reactions that take place between the oxide layer and the gases. This is expressed in a (non-linear) but nevertheless highly simplified relationship, see e.g. here. Various factors such as aging, gas type and humidity strongly influence the correlation (and thus the calibration). Bosch processes all this, as @borg already said, in a non-published algorithm. Ultimately, the sensor is particularly well suited for showing trends, but less well suited for determining an absolute level. The sensor seems to store the calibration in three calibration parameters, for which specific addresses are given in the user manual (p. 19). It should therefore be possible to read and write them. For me, it would be great if this would be possible at least via code in the TinkerForge API. One could then store the parameters externally (e.g. on a Raspby) and write them from there back to the BME680 on initialization. Personally, however, I assume that the measured values would nevertheless still fluctuate strongly. I have made good experiences regarding a fast and quite robust calibration when the sensor gets to know two extremes (outside air and e.g. a nearby tissue with spirit). For your project, however, you could consider using a CO2 sensor as an alternative. As for human emissions, both the Bosch IAQ index and CO2 are good indicators of air quality. If human emissions are dominant, both values run in good approximation parallel with a factor of about 10 (i.e. very roughly simplified: CO2 in ppm = about 10 x Bosch IAQ index). The CO2 sensor is in comparison very robust and reliable. The IAQ sensor "only" offers a "real advantage" if additional emission sources are present (e.g. cooking, peeling mandarins, cleaning solvents, ...), as they are not "noticed" by the CO2 sensor. Excursus: at this point one really has to realize that CO2 itself is only an indicator. For example, even 20,000 ppm are completely harmless to humans. Because even at a CO2 concentration of 20,000 ppm, only about 2% of the oxygen has been converted into CO2. The remaining approx. 19 % oxygen are more than sufficient for metabolism. Such CO2 concentrations are common on submarines, for example. However, among other things, carbon filters are used there to remove the substances that really have a negative impact on our well-being: VOC. Without such carbon filters, the VOCs emitted by humans usually reach a hygienically critical level after the time after which the CO2 concentration caused by humans has also risen to > 1,000 ppm. As already mentioned, the situation is different if additional VOC sources are present (e.g. plasticizer vapors from furniture, especially formaldehyde).

-
kurzes Update nach fünf Monaten: funktioniert weiterhin recht gut; bisland keine Anzeichen von Überforderung bzgl. Datenhandling beim Raspberry (außer dass er unabhängig von der gespeicherten Messdatenmenge ab und an ein wenig hängt...). Eine Frage zum Air Quality Bricklet kam mir jedoch noch auf. U.a. hier im Forum wird das Thema Selbstkalibrierung des Sensors ja recht ausführlich diskutiert. Dem habe ich entnommen, das der Sensor seine 4 bzw. 28-Tage-Kalibrierung in einen internen FlashSpeicher schreibt. Mein Eindruck ist, dass dieser geleert wird, wenn der Sensor bzw. das Bricklet stromlos ist. Stimmt das? Und wenn ja, gibt es eine Möglichkeit, den Kalibrierungs-Code auszulesen, zu Speichern und beim nächsten Start wieder in den Flash zu schreiben?
-
Hallo photron, tatsächlich konnte ich den o.g. Connection-Error nicht mehr reproduzieren... Damit bestätigt sich wohl mal wieder, dass 99 % der IT-Probleme am Nutzer liegen 😅 Habe etwas mit den einfachen GUI-Beispielen herumgespielt und da hat es in der Tat immer problemlos funktioniert, set_gui_graph_data in diverse Callbacks einzusetzen. Sorry... Gruß
-
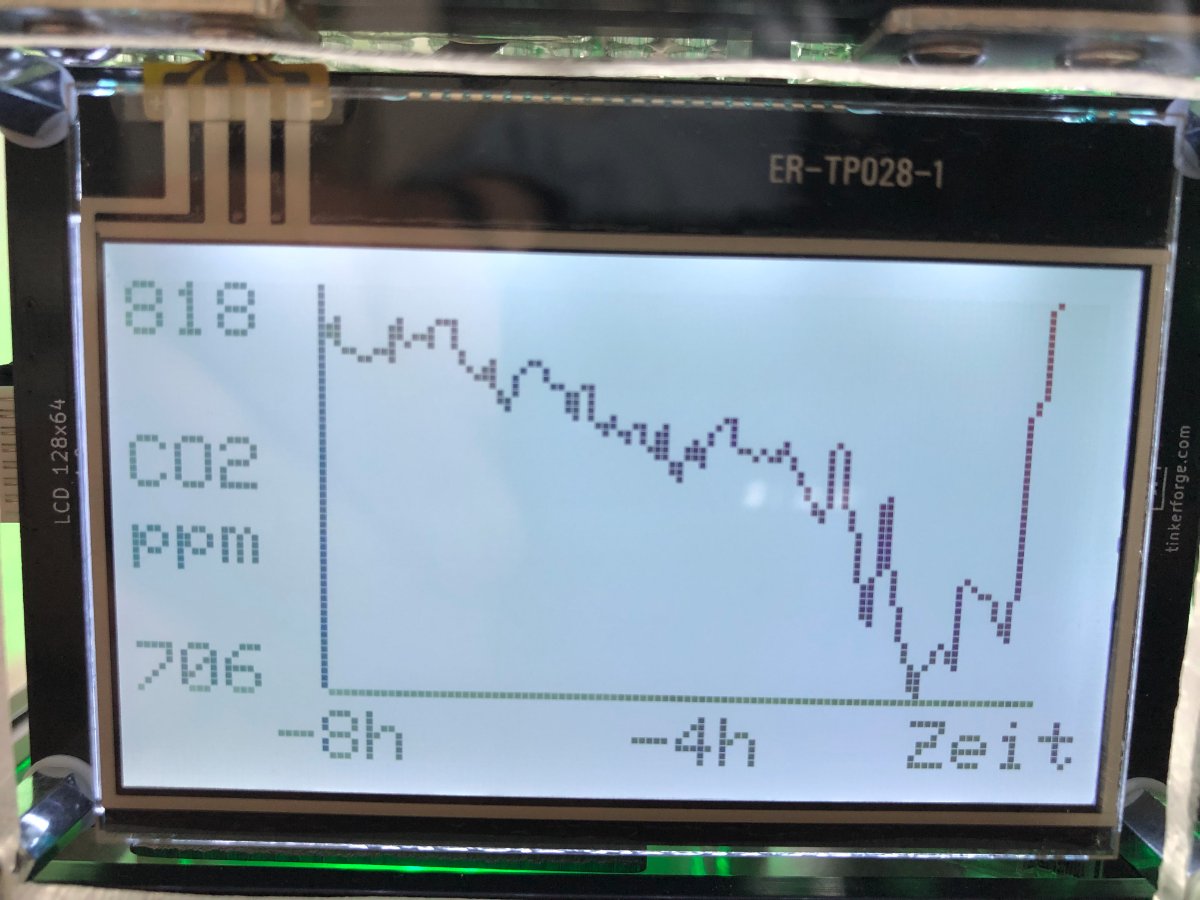
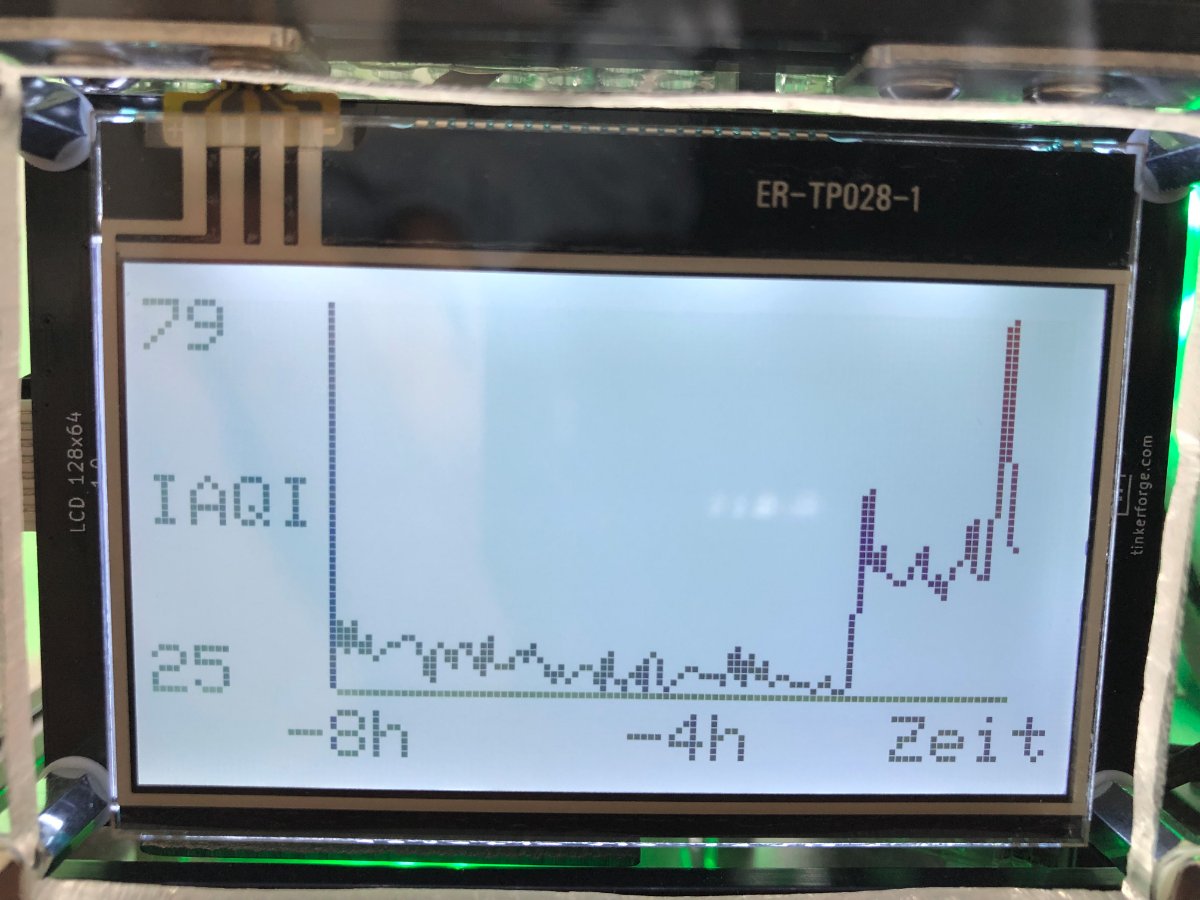
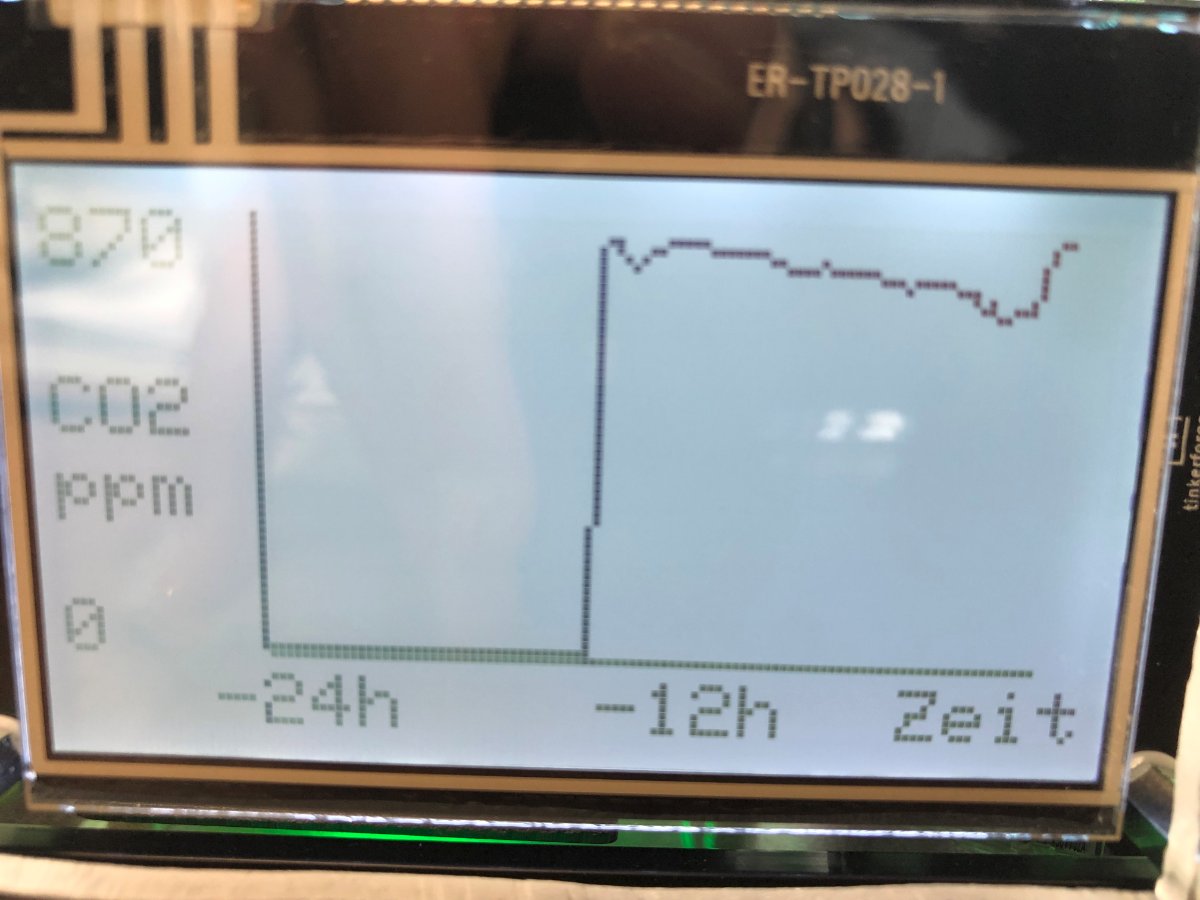
Hallo rtrbt, besten Dank für den Hinweis! Hat gut geklappt mit den Graphen. Nun lassen sich die Aufzeichnungen der letzten 8 h, 24 h, 7 Tage sowie des letzten Monats und letzten Jahres für verschiedene Messgrößen wie CO2, IAQI, T_a, PM usw. aufrufen, siehe Bilder. Zwischen einer Anzeige der einzelnen Messgrößen kann man mit der rechts/links Wischgeste wechseln, zu einem anderen Zeitintervall jeweils mit der oben/unten Wischgeste. So sind insg. 46 "Tabs" zustande gekommen, was den Code etwas aufbläht... Die Daten werden zwar immer nur bei Aufruf des jeweiligen "Tabs" aus einer Textdatei gelesen und entsprechend gemittelt bzw. skaliert; ich bin jedoch mal gespannt, ob der Raspberry Pi (4B 8 GB) das auch bei Vorliegen von Messwerten für ein ganzes Jahr noch flüssig schafft. Dann sind es 105.120 Werte bzw. Zeilen pro Messgröße, die verarbeitet werden müssen. Einzig etwas unglücklich finde ich, dass die set_gui_graph_data offenbar nicht in Callbacks (z.B. cb_touch_gesture oder von Sensoren) eingebaut werden kann, da sonst immer ein IP-Connection-Error auftritt. Demnach ist ein regelmäßiges Update der Daten für die Graphen nur mit einer for / while -Schleife möglich, oder? Beste Grüße Michael


-
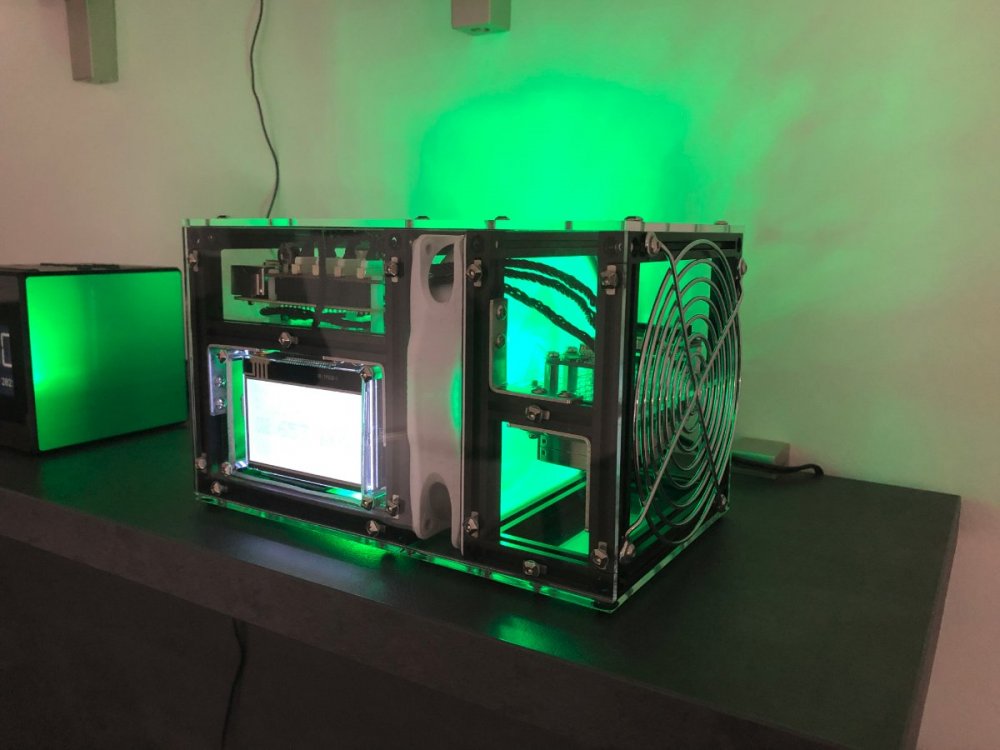
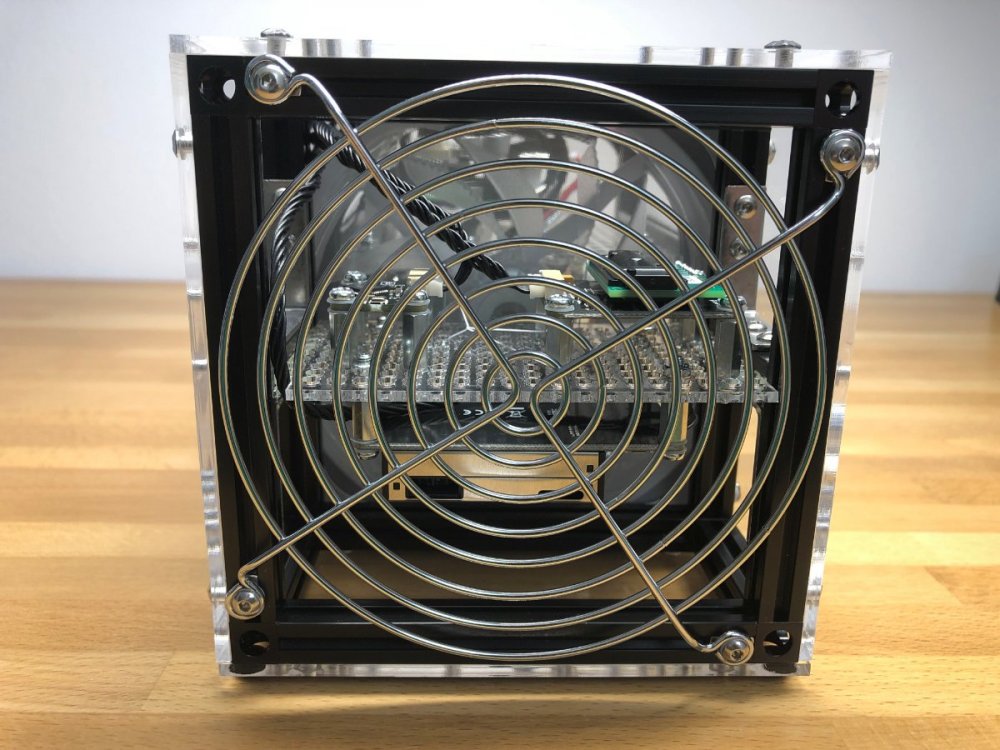
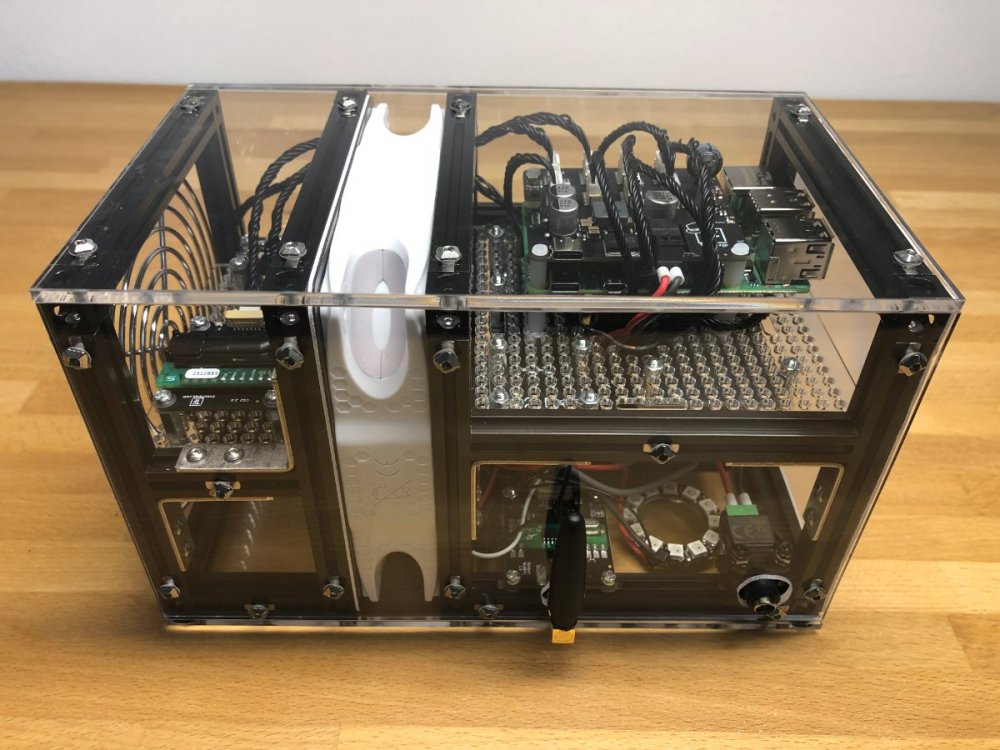
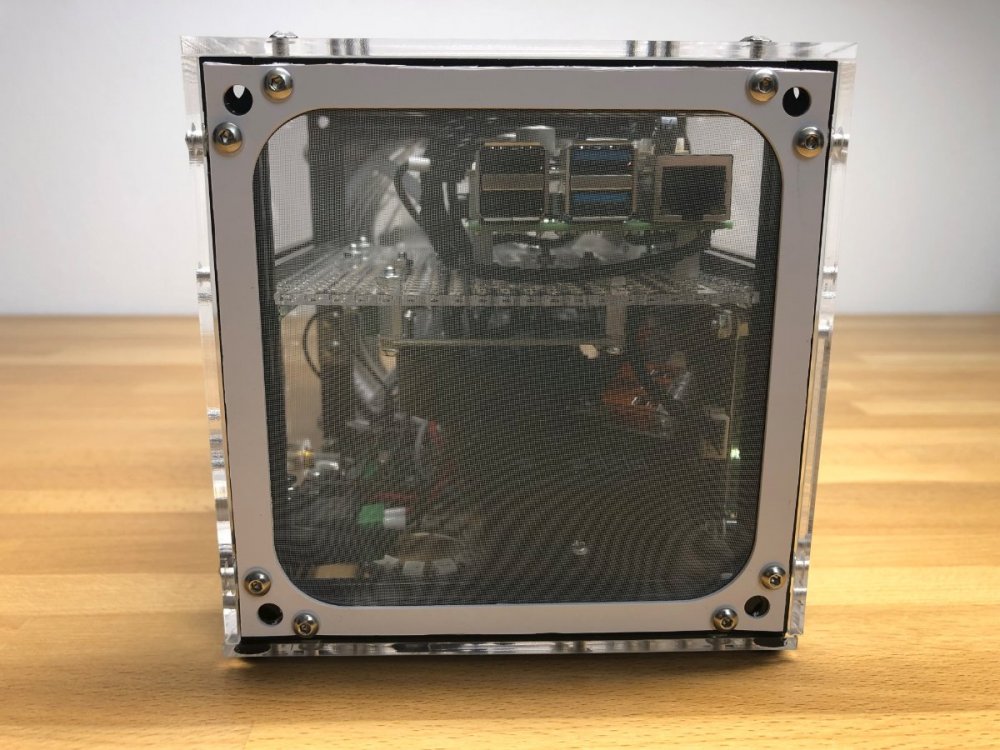
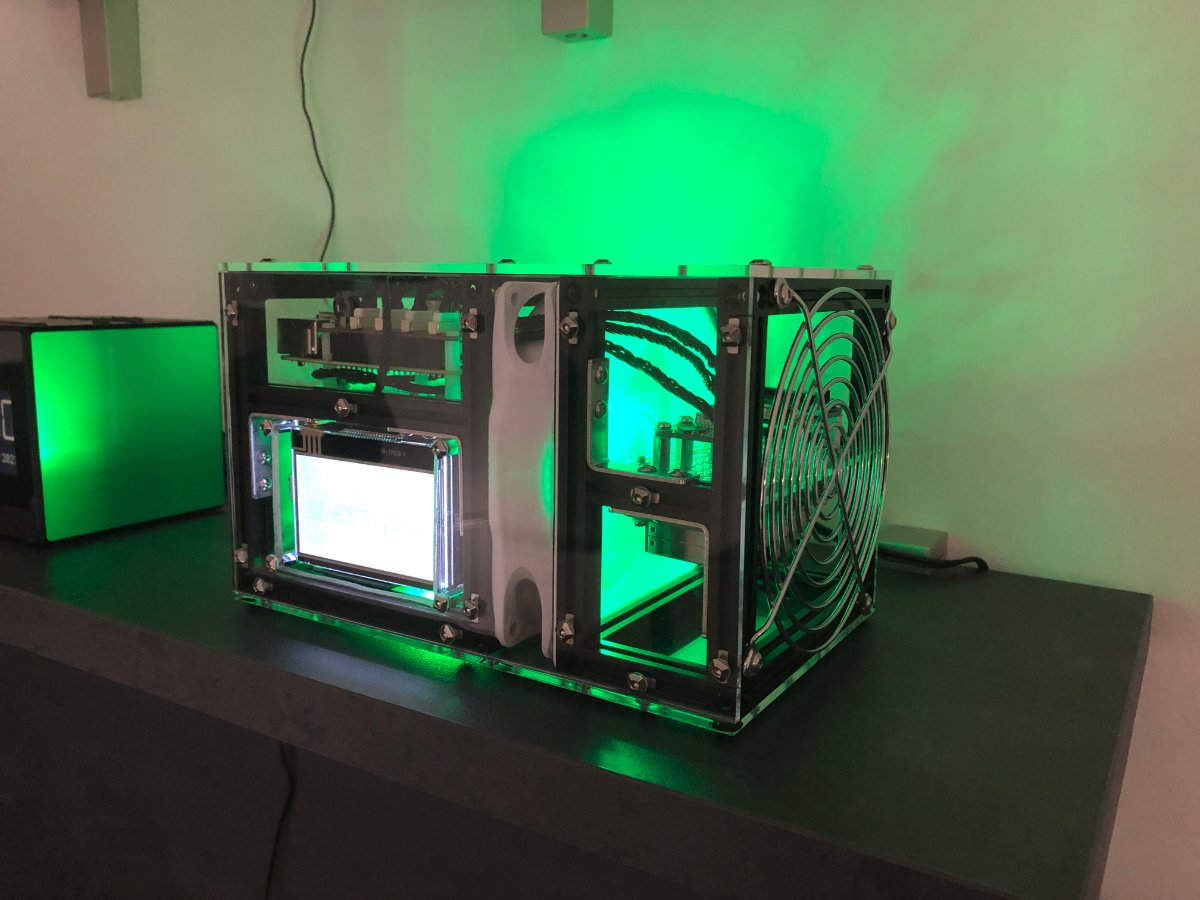
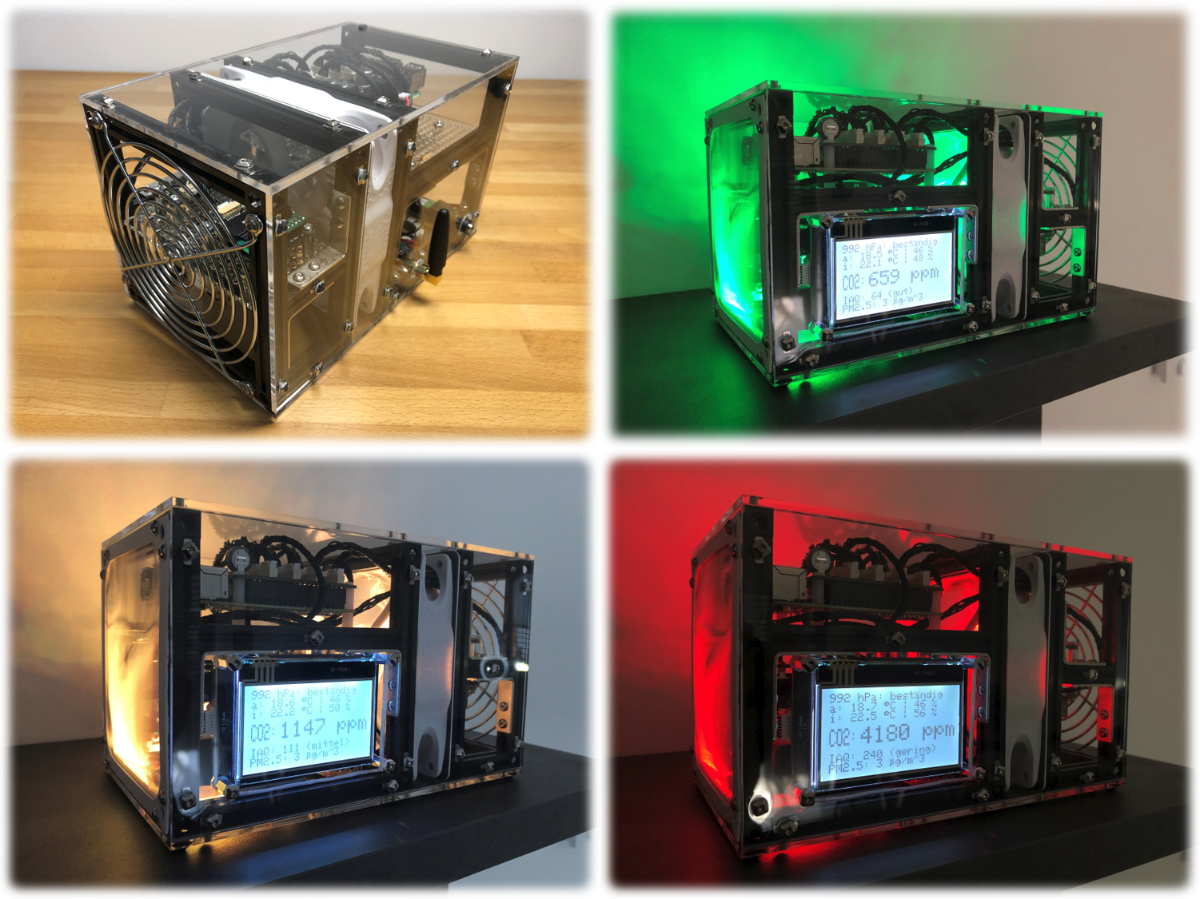
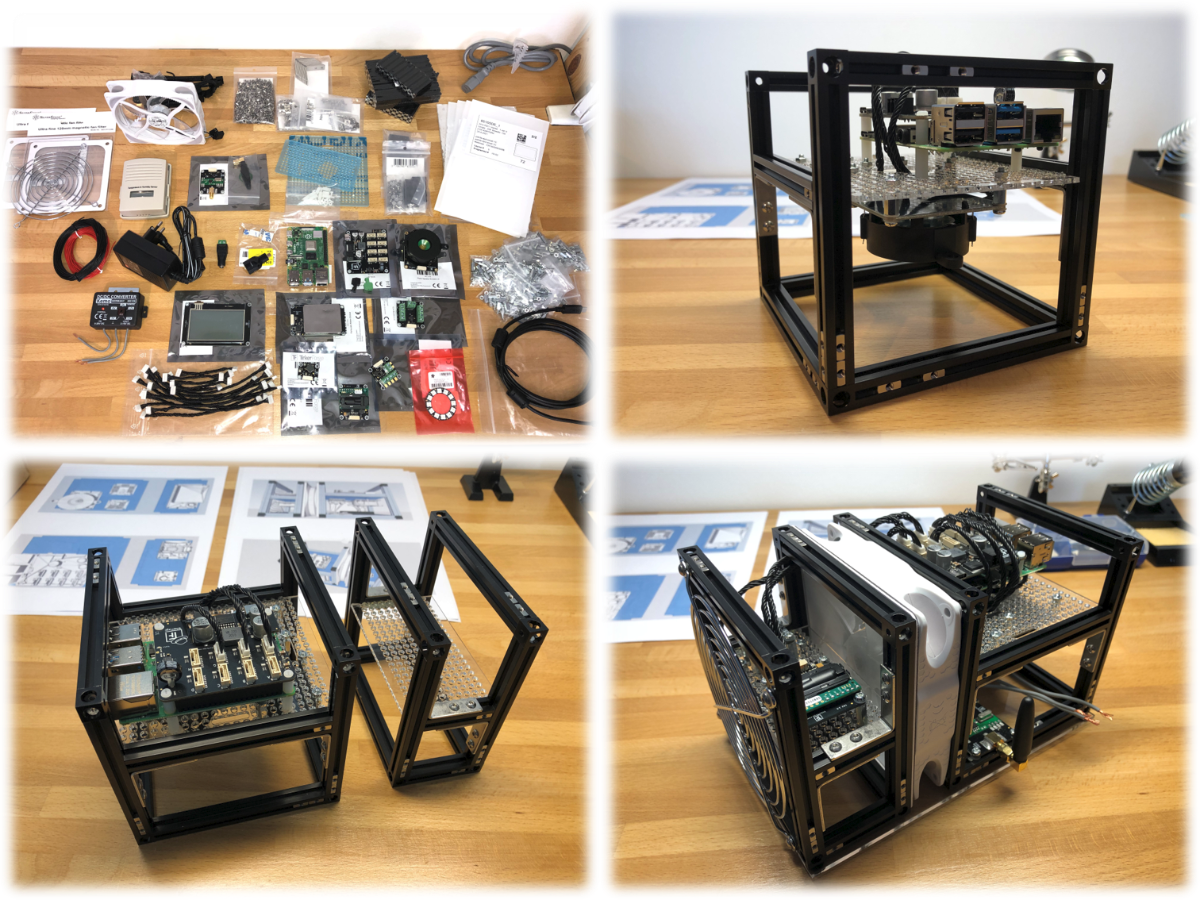
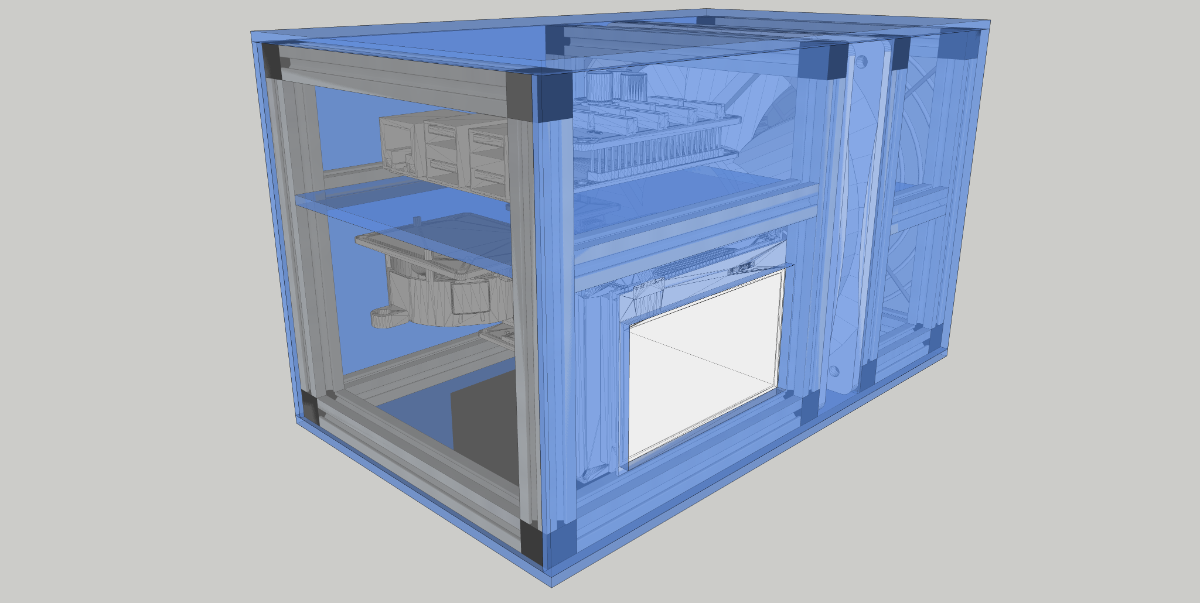
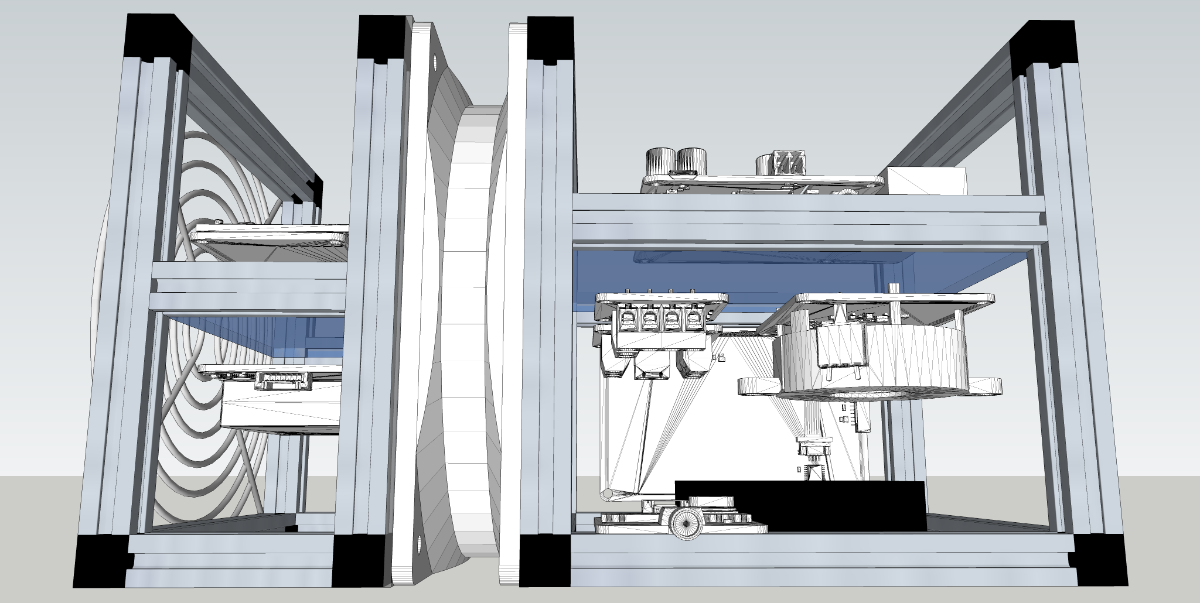
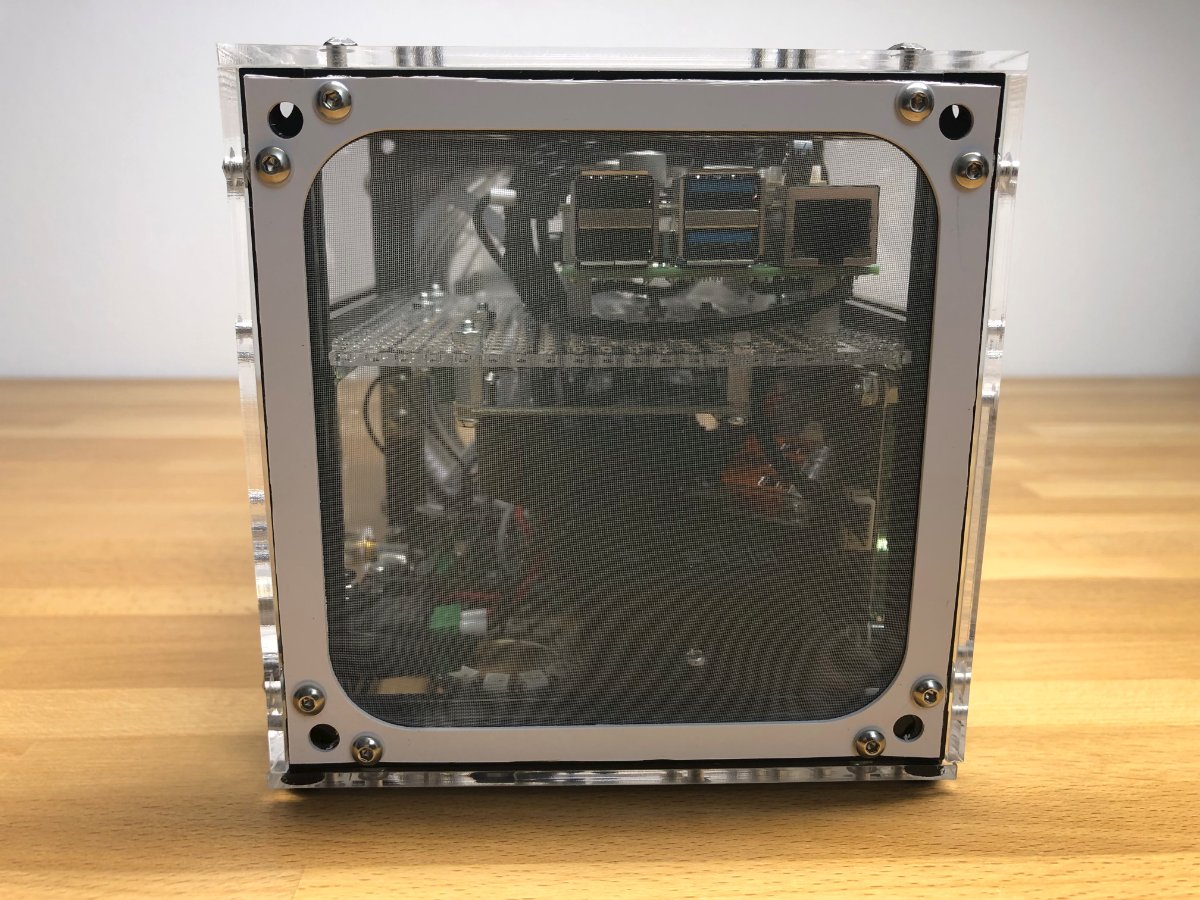
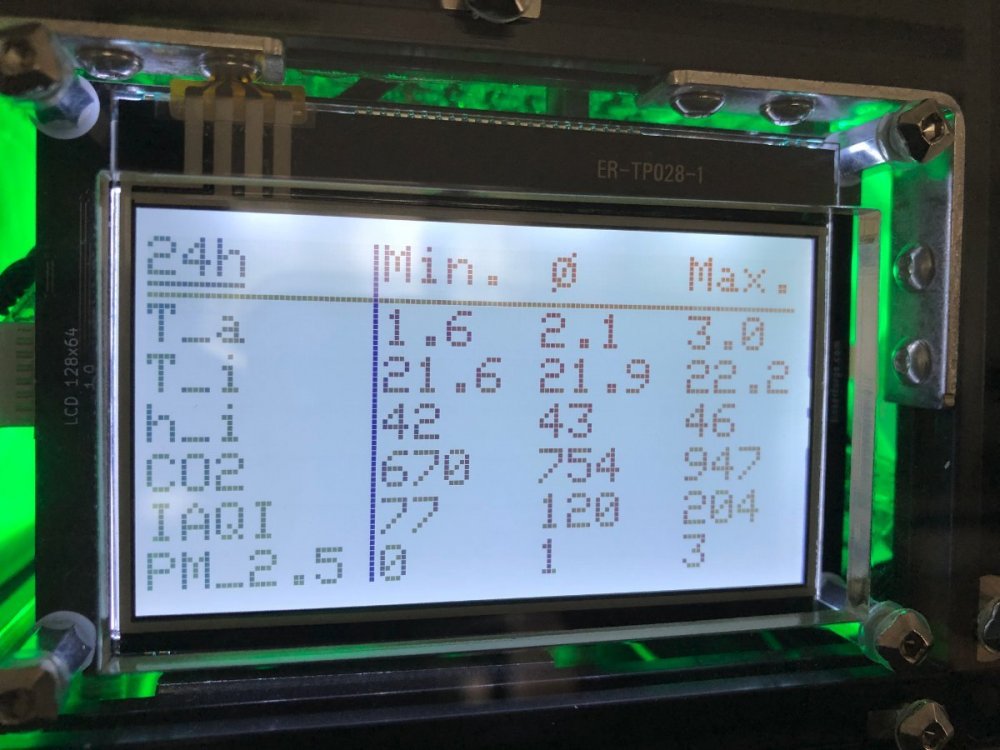
Hallo zusammen, nachfolgend möchte ich Euch eine Air-Quality-Station (vergleichbar mit einer CO2- bzw. Luftqualitäts-Ampel) als DIY-Projekt vorstellen. Diese weist darauf hin, wann ein Raum gelüftet werden muss. Gemessen werden CO2, VOC (vereinfacht: Gerüche), Temperatur, Feuchte, Luftdruck und Partikel (d.h. Feinstaub, Aersole, Sporen ect.) mittels CO2 Bricklet 2.0, Air Quality Bricklet und Particulate Matter Bricklet. Das Gehäuse der Air-Quality-Station besteht aus MakerBeam-Profilen und 3 mm Plexiglas-Platten. Es ist vorn und hinten offen, damit der integrierte Lüfter das Gehäuse durchströmen kann. Die Durchströmungsrichtung ist dabei so gewählt, dass die Sensoren direkt mit der angesaugten Raumluft beaufschlagt und nicht durch die Abwärme der sonstigen Elektronik beeinflusst werden. Außerdem sind Grobstaubfilter integriert, die zumindest die Elektronik-Bauteile schützen, die keine Messaufgaben haben. Den Aufbau habe ich zuvor mittels Google SketchUp in 3D geplant und konnte so die Abmessungen und die Anordnung der Bauteile optimieren. Im Lüfter sind bereits einige LEDs integriert, die zusammen mit weiteren LEDs (Adafruit 1643 NeoPixel) die Ampelfunktion bilden (Ansteuerung über LED Strip Bricklet 2.0 und 5 V Versorgung mittels Spannungswandler Kemo #M015N). Der Lüfter hat bionisch optimierte Schaufeln (Noiseblocker B12X-PS) und ist daher mit gedrosselter Drehzahl (PWM mittels IO-4 Bricklet 2.0) praktisch nicht hörbar. Bei einer Überschreitung der Grenzwerte für CO2 (1.000 bzw. 2.000 ppm), IAQ (100 bzw. 200) oder Feinstaub bzw. Aerosole (20 bzw. 40 µg/m³) schaltet die Ampel auf Gelb oder Rot und gibt kurze akustische Warnsignale aus (Piezo Speaker Bricklet 2.0 - siehe Video: IAQ-Station.avi). Die Messdaten werden auf einem LCD 128x64 Bricklet angezeigt. Nach Sonnenuntergang werden Ampel und die Displaybeleuchtung gedimmt und nachts abgeschaltet; es sei denn, man berührt das Display - dann erfolgt die Anzeige für weitere 30 Minuten. Außerdem ist ein Empfänger für Außentemperatur- und Feuchte integriert (Outdoor Weather Bricklet + Temperatur/Luftfeuchte Sensor TH-6148). Auf Basis der Luftdruck-Entwicklung wird zudem eine kleine Wetterprognose eingeblendet. Verarbeitet wird alles von einem Raspberry Pi 4B mit HAT Brick. Hierüber erfolgt auch die Stromversorgung mithilfe eines konventionellen 12 V Netzteils. Die gemessene elektrische Leistungsaufnahme beträgt ca. 6 W. Die Messwerte werden in einem 30 s Intervall erhoben und in einem Intervall von 5 Minuten auf der MicroSD-Karte des Raspberry Pi gespeichert. Eine Ausnahme bildet die Partikelmessung, hier wird nur im 10 Minuten Intervall gemessen und der Sensor zwischendurch deaktiviert, um die begrenzte Lebensdauer des Particulate Matter Bricklet besser auszunutzen. Ausblick: Im nächsten Schritt sollen mithilfe der aufgezeichneten Messdaten die zeitlichen Verläufe der einzelnen Messgrößen auf weiteren Display-Tabs angezeigt werden, die per Wischen aufgerufen werden. Habt Ihr Tipps für die Programmierung der Anzeige von Grafen auf dem LCD 128x64 Bricklet in Python - ohne, dass jeder Pixel einzeln definiert werden muss? Viele Grüße Michael Bilder: